

You're Probably Attending the Wrong Trade Shows
Here's a number that should make every B2B marketer pause: the average company spends $40,000–$100,000 per trade show when you factor in booth costs, travel, staffing, and lost productivity. Yet most teams choose which events to attend based on little more than habit, a colleague's recommendation, or a flashy sponsorship deck.
Choosing the right events is the first step toward maximizing your trade show ROI.
The result? Booths filled with unqualified foot traffic, sales teams returning with stacks of business cards that never convert, and leadership questioning whether events are worth the investment at all.
Choosing the right trade show means selecting events where your ideal customers actually gather — not just the biggest or most well-known conferences in your industry. It's the single most impactful decision in your entire event marketing strategy, because no amount of brilliant booth design or pre-show outreach can compensate for being at the wrong event.
This guide walks you through a data-driven framework for evaluating and selecting trade shows that deliver measurable pipeline and revenue — not just brand impressions.
Why Trade Show Selection Is Your Highest-Leverage Decision
Most event marketing teams spend the bulk of their energy on execution: designing booths, planning demos, training staff, and coordinating logistics. But the selection of which events to attend determines 80% of your outcome before you even register.
Research from the Center for Exhibition Industry Research (CEIR) consistently shows that pre-event planning is the top predictor of exhibitor satisfaction and ROI. Companies that systematically evaluate events based on attendee data consistently generate 2–3x more qualified meetings per event than those relying on intuition. The difference isn't better booth placement or slicker collateral — it's simply being in the room with the right people.
The financial stakes are significant. A mid-sized B2B company attending 4–6 events annually commits $200,000–$600,000 in total event spend. Choosing even one wrong event wastes $50,000+ in direct costs and, more critically, the opportunity cost of missing an event where your target accounts were actually present. For sales teams working enterprise deals with 6–12 month cycles, a missed face-to-face opportunity at the right trade show can mean a lost quarter.
The challenge is that traditional event selection relies heavily on subjective signals: industry reputation, peer recommendations, event size, and past attendance. These factors matter, but they tell you very little about the question that actually determines ROI — will your specific target customers be there?
How to Evaluate and Select the Right Trade Shows: A 6-Step Framework
Step 1: Define Your Ideal Event Profile Before Browsing
Before you open a single event directory, get specific about what a high-ROI event looks like for your business. Start with your Ideal Customer Profile (ICP) and work backward to the events those companies attend.
Write down the industries, company sizes, job titles, and geographic regions that define your best customers. Then layer on practical constraints: budget per event, team availability, and travel logistics. This profile becomes your evaluation filter — every event you consider must pass through it.
Pro Tip: Don't just think about your current customers. Review your last 10 closed-won deals and identify where those buyers typically network. The events where your best customers gather may be different from where your average customers go.
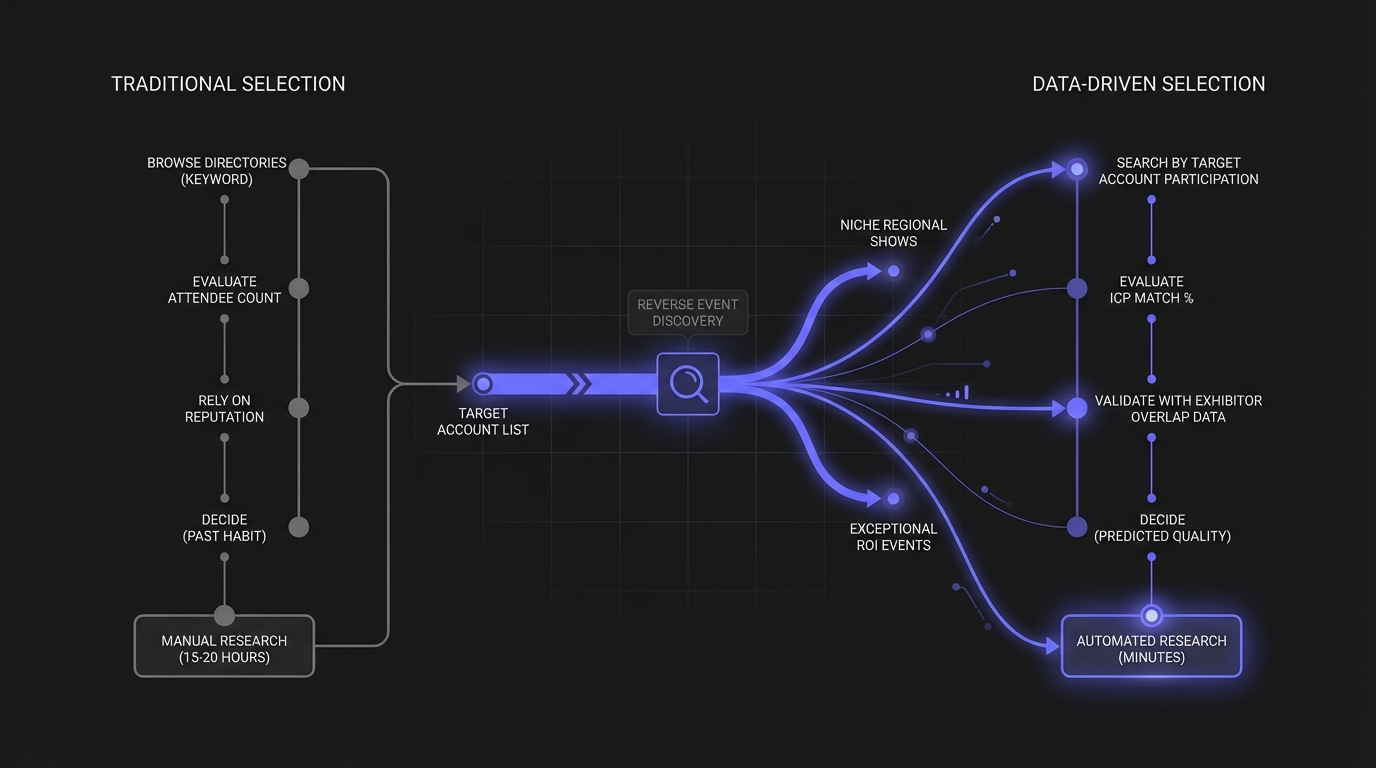
Step 2: Research Exhibitor Lists, Not Just Attendee Counts
Event websites love to advertise impressive numbers — "10,000+ attendees" or "500+ exhibitors." But raw attendance numbers tell you nothing about attendee quality. A 2,000-person niche conference where 30% of attendees match your ICP is far more valuable than a 20,000-person mega-expo where less than 5% are relevant.
The most reliable signal for event quality is the exhibitor list. Exhibitors invest significant money to be at an event, which means they've validated its relevance to their market. If your target customers, competitors, and complementary vendors are exhibiting, it's a strong indicator that the right audience attends.
This is where tools like Lensmor's reverse event discovery become invaluable. Instead of manually checking exhibitor lists across dozens of event websites, you can input your target account list and instantly see which trade shows those companies participate in. This exhibitor-first approach surfaces events you might never have found through traditional directory searches — including niche regional shows that fly under the radar but deliver exceptional ROI.
Pro Tip: Pay special attention to events where 3+ of your top 20 target accounts exhibit. This clustering effect signals that the event is a genuine gathering point for your market, not just a broad industry mixer.
Step 3: Analyze Attendee Quality Over Quantity
Once you've shortlisted events based on exhibitor data, dig deeper into attendee composition. The metrics that actually predict ROI are far more granular than total headcount.
Look for events that publish attendee demographics in their prospectus: job titles, seniority levels, company sizes, and purchasing authority. A trade show where 40% of attendees hold VP or C-level titles is fundamentally different from one dominated by individual contributors — even if both claim "10,000 attendees."
Request past attendee reports from event organizers. Most will share anonymized breakdowns to serious prospective exhibitors. Compare the seniority distribution, industry breakdown, and company size profile against your ICP. If fewer than 20% of attendees match your target buyer persona, the event is unlikely to deliver strong pipeline results regardless of its prestige.
For events where public attendee data is limited, attendee prediction tools can fill the gap. Lensmor's prediction engine analyzes historical attendance patterns, social media signals, and event partnerships to forecast who will attend upcoming shows — giving you intelligence that's typically unavailable until after registration closes.
Pro Tip: Calculate your cost per qualified contact for each event. Divide total event cost by the estimated number of ICP-matching attendees. This normalizes the comparison across events of different sizes and costs, making it easy to rank your options objectively.
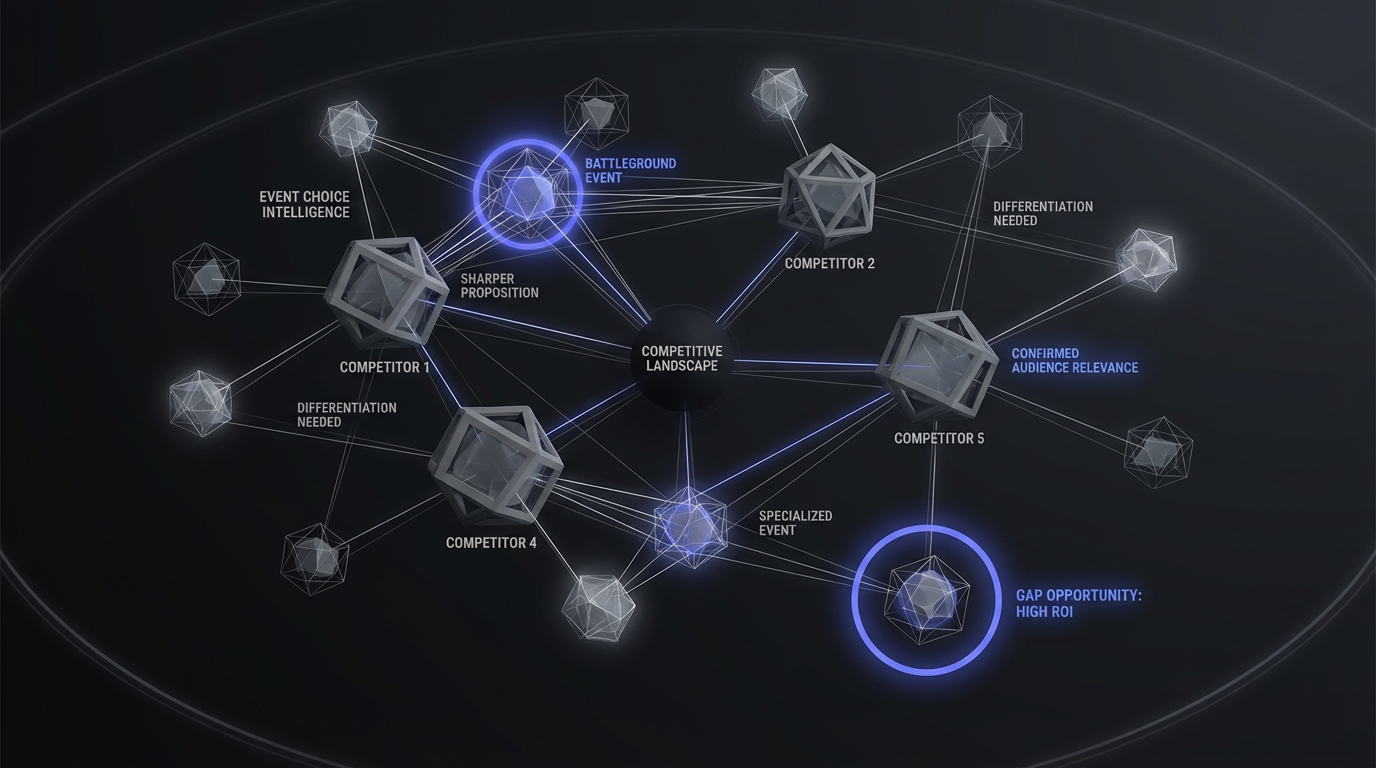
Step 4: Evaluate Competitive Presence Strategically
Your competitors' event choices contain valuable intelligence. If three of your top competitors consistently exhibit at a specific trade show, it means one of two things: the event attracts buyers in your space, or the event has become a competitive battleground where differentiation is difficult.
Both scenarios are worth understanding. An event with strong competitor presence confirms audience relevance, but it also means you'll need a sharper value proposition and more aggressive pre-show outreach to stand out. Conversely, discovering a relevant event where competitors are absent represents a significant opportunity — you may find less noise and more receptive buyers.
Map your top 5–10 competitors across your shortlisted events. Look for the gap events: shows where your target customers attend but your competitors don't. These are often mid-sized, specialized events that larger competitors overlook, and they frequently deliver the highest ROI per dollar spent.
Step 5: Score and Rank Events Using a Weighted Framework
With research complete, move from qualitative assessment to quantitative ranking. Create a simple scoring matrix that weights the factors most important to your business.
A proven framework uses five criteria, each scored 1–5:
Multiply each score by its weight and sum them for a total event score. This approach eliminates subjective bias and makes it easy to compare events across different regions, sizes, and formats.
Pro Tip: Run this scoring exercise as a team. Sales, marketing, and leadership often weight criteria differently, and the conversation itself surfaces assumptions that improve decision quality. A 30-minute scoring session can prevent $50,000+ in misallocated event budget.
Step 6: Build a Balanced Annual Event Calendar
With your ranked list in hand, build an annual calendar that balances proven performers with strategic experiments. A strong portfolio follows the 70/20/10 rule:
70% proven events — trade shows that have consistently delivered pipeline in previous years. These are your foundation and should receive the majority of your budget and best staffing.
20% high-potential events — shows that scored well in your evaluation but you haven't attended before. These represent growth opportunities and keep your strategy from becoming stale. Attend with a smaller team and clear success metrics.
10% experimental events — emerging or niche events that could become future top performers. Keep investment minimal — perhaps just a badge and a few scheduled meetings — but track results carefully.
This balanced approach prevents the common trap of repeating the same event lineup year after year while the market shifts around you. Industries evolve, new events emerge, and buyer behavior changes. Staying current with resources like Trade Show News Network (TSNN) helps you spot emerging events early. Your event portfolio should reflect that dynamism.

Stop Guessing, Start Choosing Strategically
Choosing the right trade shows isn't about finding the biggest event or the one with the most buzz. It's about systematically identifying where your specific buyers gather and allocating your budget accordingly. The six-step framework above transforms event selection from an annual guessing game into a repeatable, data-driven process.
The companies that consistently win at trade shows aren't the ones with the biggest booths — they're the ones who made the right selection decision months before the event doors opened. Start with your target accounts, validate with exhibitor data, score objectively, and build a balanced portfolio.
If you're ready to replace weeks of manual event research with data-driven event intelligence, Lensmor can help. Search events by target account participation, predict who will attend, and make every event dollar count.
Start Free Trial - Get early access to Lensmor's event intelligence platform.