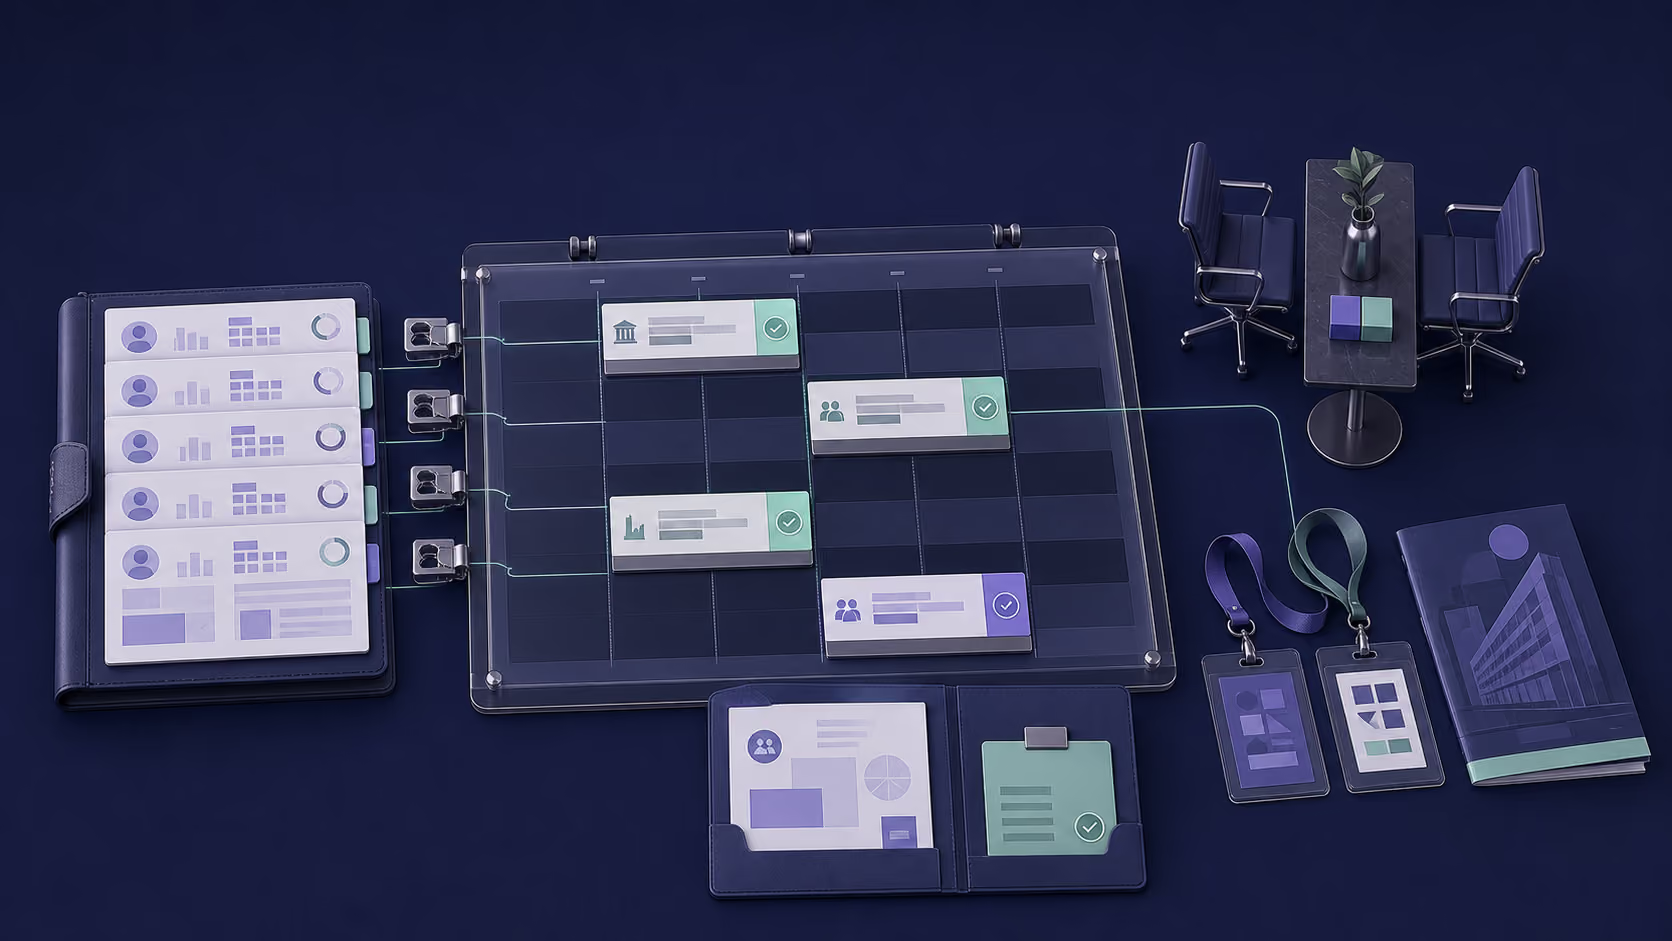

Event analytics is the practice of connecting event activity, attendee feedback, commercial progress, and cost data to specific business decisions. For B2B teams, it should answer what changed because of an event, how strong the evidence is, and what the team should do next.
That is a much higher bar than filling a dashboard. A show can attract a large crowd, produce strong session ratings, and still fail to reach the accounts that justify the spend. Another event can look quiet while generating a small number of conversations that advance important opportunities.
The useful question is not “Which metrics can we collect?” It is “Which decision will this evidence change?” This guide shows how to build that decision system before, during, and after a B2B event.
What is event analytics?
Event analytics turns event data into an explanation and a decision. It combines information from registration, attendance, meetings, content, surveys, CRM activity, and finance, then interprets those signals against an event's original goals.
Guidebook defines event analytics as measuring and analyzing event data to improve performance and engagement. It also separates analytics from isolated metrics, reporting, and ROI. Review Guidebook's event analytics definition.
That distinction matters. A badge-scan count is a metric. A post-show deck is a report. Revenue divided by event cost is an ROI calculation. Analytics asks why the numbers changed, whether they support the same conclusion, and what action follows.
In this article, “event” means a physical or hybrid B2B conference, trade show, executive gathering, or field program. It does not mean a click or product action inside software analytics.
How is event analytics different from metrics, reporting, and ROI?
Metrics describe; reporting organizes; ROI calculates; analytics decides. Teams need all four, but they should not use the terms as if they mean the same thing.
Your event ROI framework can supply the financial calculation. A post-event report template can organize the readout. Event analytics sits underneath both: it defines which evidence is trustworthy enough to support the conclusion.
Why should event analytics start with a decision?
A metric earns its place only when a possible result changes an action. Write the decision before choosing the data source.
Imagine a hypothetical company spending $85,000 on a three-show program. Leadership must decide whether to renew the third event at the same sponsorship level. The team records 420 booth scans at that show, the largest total in the program.
Scan volume alone suggests renewal. But suppose only 18 scans matched target accounts, six conversations met the agreed qualification rule, and two meetings advanced an existing opportunity. Another show produced 160 scans, 42 target-account matches, 15 qualified conversations, and seven advanced meetings.
The first show cost $85,000 ÷ 6, or about $14,167 per qualified conversation. The second cost the same amount divided by 15, or about $5,667. This example is hypothetical, and neither calculation proves revenue. It does show why volume, fit, and commercial progress must remain separate.
The decision might be to reduce the third show's footprint, change the audience strategy, or leave the portfolio entirely. The analytics system should make those options visible before a renewal deadline.
Pro Tip: Put the contract or sponsorship renewal date in the measurement plan. A perfect analysis delivered after the cancellation window cannot change the decision.

Which evidence layers belong in B2B event analytics?
Use four evidence layers: audience fit, engagement, commercial progression, and economics. Keeping them separate prevents a strong number in one layer from disguising weakness in another.
Audience fit
Audience-fit data asks whether the right organizations and people were present. Useful fields include target-account matches, role relevance, industry fit, region, existing relationship, and customer or prospect status.
Registration is not attendance. Attendance is not access. A target executive can appear on a list without visiting the booth, accepting a meeting, or speaking with the team. Track each state independently.
Engagement
Engagement data records what people did: checked in, attended a session, visited a booth, joined a meeting, downloaded a resource, answered a poll, or completed a survey.
These actions have different meanings. A session check-in may reflect interest in a topic. A pre-booked meeting reflects a stronger commitment of time. Neither action automatically proves purchase intent.
Commercial progression
Commercial data records what happened after the interaction. Examples include accepted follow-up, opportunity association, stage movement, partner review, customer expansion action, or a documented “not a fit” outcome.
This layer needs sales agreement. Marketing should not define an “advanced opportunity” after the event if sales uses a different acceptance rule in the CRM.
Economics
Economic data includes sponsorship, travel, labor, production, agency, technology, and opportunity costs. It also includes revenue or pipeline evidence when the attribution window is mature enough.
Use the same cost boundary across events. Comparing a fully loaded cost for one show with only the booth invoice for another produces a false ranking.
How do you build an event measurement plan?
A measurement plan connects each business decision to a metric, source, owner, time window, and threshold. Build it while the event is still being planned.
Start with one primary decision. “Should we return?” is better than “Measure event success.” Then identify the evidence that would support renewing, changing, or stopping the investment.
For every metric, record the system of record. Registration lives in the event platform. Meeting acceptance may live in a calendar or scheduling tool. Opportunity movement belongs in the CRM. Actual cost belongs in finance. Survey sentiment belongs in the survey tool, not in a rep's memory.
Next, define the denominator. “15 target accounts engaged” means little without knowing whether 20 or 500 target accounts attended. Rates become comparable only when the population is stable and documented.
Finally, set the observation window. On-site activity can be final within days. Enterprise opportunity progression may need 30, 60, 90, or more days. A single deadline for every metric forces premature conclusions.
Pro Tip: Write thresholds before the show. If the team decides what “good” means after seeing the result, the scorecard becomes a defense of past spending.
What should you track before the event?
Pre-event analytics measures audience access and execution readiness. It tells the team whether the plan is on track while there is still time to change it.
Track target-account coverage, relevant contacts identified, outreach delivered, replies, meeting requests, accepted meetings, cancellations, and capacity. A meeting target without available calendar slots is not a real plan.
Use stable campaign identifiers across landing pages, email, paid media, partner links, and calendar records. Google's Analytics documentation explains that UTM parameters identify source, medium, campaign, and related campaign values in acquisition reporting. Google also warns that inconsistent or missing parameters fragment reporting. Read Google's campaign URL guidance.
Do not overload UTMs with personal data or informal labels. Use a controlled naming convention such as event code, year, channel, audience, and asset. Document capitalization and separators once, then enforce them.
Pre-event analysis should produce interventions. If the right accounts appear likely to attend but meeting acceptance is weak, change the message or the offer. If acceptance is strong but coverage is low, expand research. If calendars are full, stop optimizing for more replies and protect meeting quality.
What should you track during the event?
Live analytics should detect operational exceptions, not declare final ROI. Use it to improve what can still be changed on site.
Compare planned meetings with check-ins, completed meetings, walk-up conversations, staffing capacity, session attendance, and unresolved follow-up. Track reasons for missed meetings when known. “No-show” and “team conflict” lead to different fixes.
Record conversation context in a structured form: account, person, topic, need, evidence, agreed next step, owner, and deadline. Keep free text for nuance, but do not make every rep invent a new vocabulary.
The on-site view should highlight exceptions. Which high-priority account arrived without an owner? Which meeting changed location? Which session attracted a relevant audience that had not been targeted? Which promised follow-up is still unassigned?
Pro Tip: Do not rank people by a single activity score. Use engagement to route attention, then require human qualification before changing account priority or sales ownership.

What should you track after the event?
Post-event analytics connects experience evidence to owned follow-through and later business outcomes. It needs more than one review date.
In the first two business days, reconcile attendance, meetings, conversations, notes, and missing owners. Remove tests and obvious duplicates without erasing the original import. Record why each row changed.
Within the first week, review attendee feedback, content performance, sponsor delivery, and operational exceptions. Cvent's event reporting guidance groups evidence across attendance, pipeline or bookings, meetings, satisfaction, content, sponsorship, and budget. See Cvent's event reporting guide.
At the agreed sales-cycle checkpoints, update opportunity acceptance, stage movement, revenue, customer actions, and partner progress. Do not rewrite the original event snapshot. Append the later outcome so analysts can distinguish what was known at each date.
Use a decision log. For every important finding, capture the evidence, confidence, decision, owner, deadline, and next review. This is where analytics becomes operational rather than decorative.
How do you connect event data across systems?
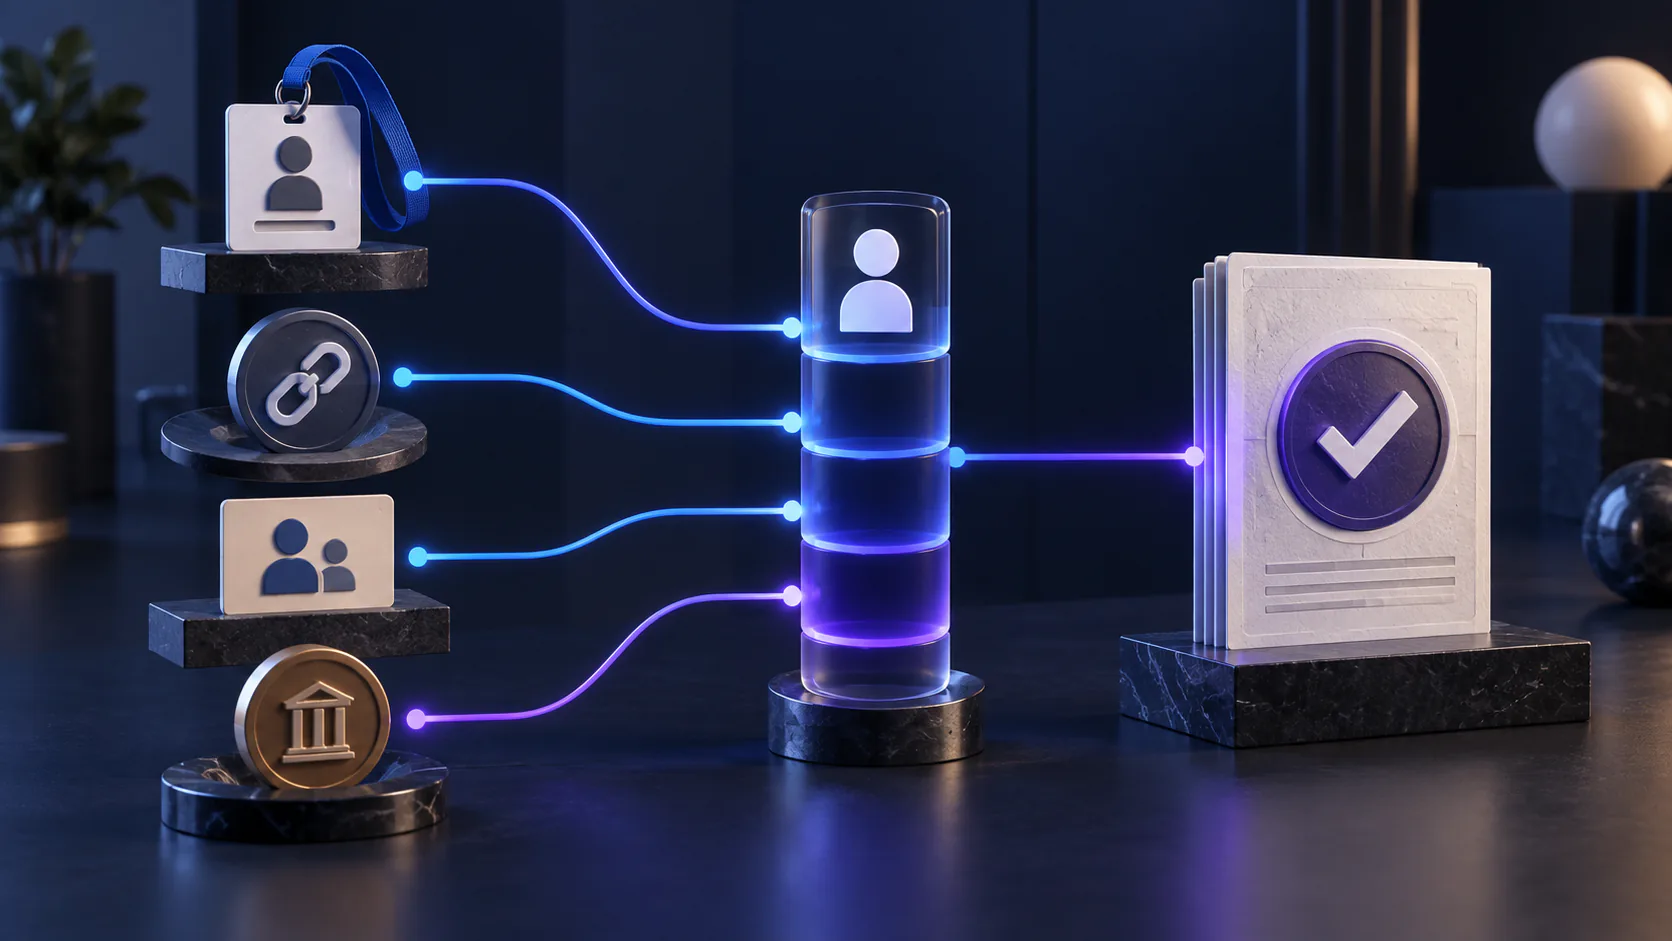
Use stable event, account, person, campaign, and interaction identifiers. Names alone are not reliable join keys.
An event can appear as “Cloud Expo,” “Cloud Expo 2026,” and an internal campaign code. A company can appear under a brand, subsidiary, or legal entity. One person may register with a personal email and later enter the CRM under a work address.
Build a small data contract. Define the canonical event ID, account-matching rule, person-matching rule, timestamp timezone, source system, record owner, and allowed status values. Preserve the raw source value beside the normalized value.
The minimum useful interaction record includes who, which account, which event, what happened, when, where the evidence came from, and who owns the next step. Add confidence when a match is inferred rather than confirmed.
Your B2B buying-signals guide explains why multiple signals are more useful than one isolated action. The same principle applies here: corroboration increases confidence, but it does not remove the need for a documented interpretation.
What belongs in an event analytics dashboard?
A dashboard should show decisions, trends, and exceptions—not every field the stack can export. Give each audience the smallest view that supports its job.
The on-site team needs upcoming meetings, priority accounts, missing owners, and operational issues. Event marketing needs audience coverage, engagement patterns, sponsor delivery, and follow-up completion. Revenue leaders need accepted progression, mature outcomes, cost, and portfolio comparisons.
Show denominators and time windows beside rates. Label forecast, observed, self-reported, inferred, and financially confirmed values. If a number can change after the report date, show the “as of” timestamp.
Avoid a single composite event score unless every component and weight is visible. A score of 82 hides whether the event performed well on audience fit and poorly on economics, or the reverse.
Which tools support event analytics?
Choose tools by evidence function, not by the promise of one universal dashboard. Most teams need a connected set of systems.
An event platform can manage registration, attendance, sessions, meetings, and surveys. Web analytics can record campaign traffic. A CRM can hold account, contact, opportunity, and follow-up states. Finance provides the authoritative cost boundary. A warehouse or BI layer can join records and preserve time-stamped snapshots.
The selection question is not “Does this tool have analytics?” Ask whether it exports stable identifiers, retains raw records, documents field definitions, supports access controls, and lets the team reconcile changes.
Start with the systems already trusted for each data type. Add technology only when a missing connection blocks a decision. Buying a larger dashboard will not repair inconsistent campaign names or undefined opportunity stages.
How do you keep event analytics trustworthy?
Trust depends on definitions, lineage, identity resolution, and review. A polished chart cannot compensate for a weak denominator.
Document metric definitions and version changes. Preserve raw imports. Separate corrected records from deleted records. Track match confidence for accounts and people. Restrict personal data to what the workflow needs and apply the organization's consent, retention, and access rules.
Reconcile totals between systems. If the event platform reports 800 attendees and the warehouse holds 742, explain the gap before using a rate. Check whether staff, exhibitors, duplicates, test registrations, late syncs, or timezone boundaries caused the difference.
Record limitations next to conclusions. “Seven opportunities advanced within 60 days after an event interaction” is an observation. “The event caused seven advances” is a causal claim that usually needs stronger evidence.
Pro Tip: Keep an exception log beside the dashboard. Repeated mismatches often reveal a process problem that matters more than another visualization.
How do you implement event analytics in seven steps?
Start small enough to produce one trusted decision, then extend the system. Use this sequence:
- Choose one decision. Name the budget, audience, format, sponsorship, content, or follow-up choice the analysis must support.
- Define the evidence layers. Select audience-fit, engagement, commercial, and economic measures relevant to that choice.
- Assign systems of record. Give every metric one authoritative source and one accountable owner.
- Create stable identifiers. Standardize event, campaign, account, person, and interaction keys before data starts arriving.
- Set thresholds and time windows. Decide what result will trigger renewal, change, investigation, or exit—and when the evidence will be mature.
- Run live and post-event reviews. Use live data for recoverable exceptions, then preserve dated snapshots for later commercial outcomes.
- Write the decision log. Record what the team decided, why, who owns it, and when the result will be checked.
Do not begin with a request for “all available data.” Begin with the decision that has the highest financial or operational consequence. Once that chain is trustworthy, repeat the model for the next decision.
What is the practical takeaway?
Event analytics works when it keeps evidence layers distinct and makes action explicit. Define the decision first, instrument the full event lifecycle, connect records with stable identifiers, and wait for each outcome to mature before making a stronger claim.
The goal is not a more impressive recap. It is a repeatable way to invest, change, or stop with evidence the team can audit.
Start Free Trial — Start using Lensmor's event intelligence platform today. Predict attendee lists, discover relevant events, and enrich contact data for your next trade show.